What 4.5% 10-Year Treasury Means for Every Asset Class
"The interest rate is to asset prices roughly what gravity is to the apple. It doesn't matter much when it's low. But when rates rise, everything comes back to earth."
Warren Buffett, 2013 Berkshire Annual Meeting
The Changing Regime
I started the year expecting rates to drift higher. The 10-year Treasury opened 2026 near 4.2%, and the consensus view was a gradual glide toward something lower as the Fed completed its easing cycle. That glide never happened. The 10-year has since climbed to 4.4%, and I continue to set my true north at 4.5%: approximately 25 basis points above where we started the year and meaningfully above what most allocation models priced as a baseline when capital was deployed in the last few years.
The proximate driver is well-known: the Strait of Hormuz has been effectively closed since late February following military action in the Middle East, producing the largest inflation-adjusted oil price surge since 1988. WTI crude, which began the year near $61 per barrel, has since traded into triple digits. But the inflation problems run deeper than the recent oil shock. Core inflation (ex food and energy) and Core Services (excluding goods) were already firming up ahead of the oil supply disruptions. This presents fundamental challenges to the Fed’s ability cut rates as consensus had demanded as recently as March.
Core PCE stood at 3.2% in March, and the Fed's own 2026 year-end forecast is 2.7%. Neither figure gives the FOMC room to pivot. The April 29 meeting produced hawkish dissents and the market has now priced zero cuts for all of 2026. I am of the view that at least one surgical rate hike is looming in the fourth quarter.
What the Data Shows
I ran two independent studies to answer this question empirically, not theoretically. The first quantifies the NAV impact of each 25 basis point rate move in the 10 year treasury bond across five private market asset classes. The second examines how equity sectors have performed historically in rising rate regimes, using monthly data from January 2000 through March 2026. Taken together, they tell a precise and uncomfortable story.
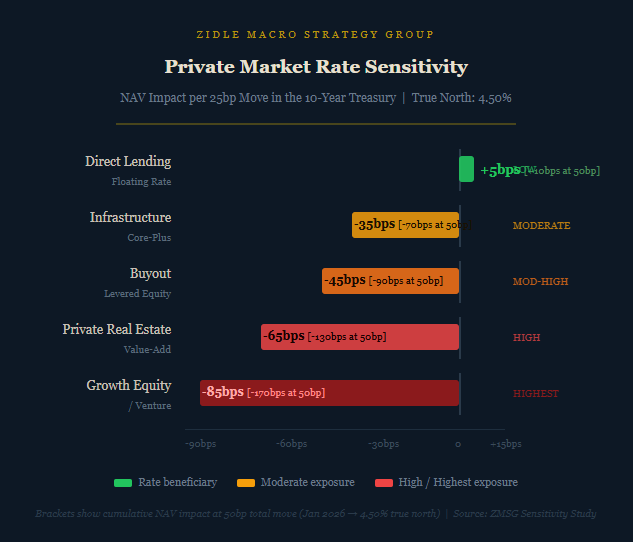
Start with private markets, because that is where the leverage lives and where the marks are slowest to reflect reality. Direct lending, floating rate by construction, is the lone beneficiary: plus 5 basis points of NAV impact per 25 basis point move, as higher coupons on senior secured loans offset modest borrower stress. Infrastructure (core-plus) absorbs minus 35 basis points per move, partially cushioned by CPI escalators in its cash flows. Buyout (levered equity) is worse: minus 45 basis points per move, as discount rate compression hits exit multiples and higher LBO financing costs reduce entry leverage simultaneously. Private real estate (value-add) is at minus 65 basis points per move, driven by cap rate expansion and refinancing costs that punish floating-rate debt at the asset level. At the far end, growth equity and venture sits at minus 85 basis points per move. Terminal value dependency means long-dated cash flows bear the full discount rate impact with no offset.
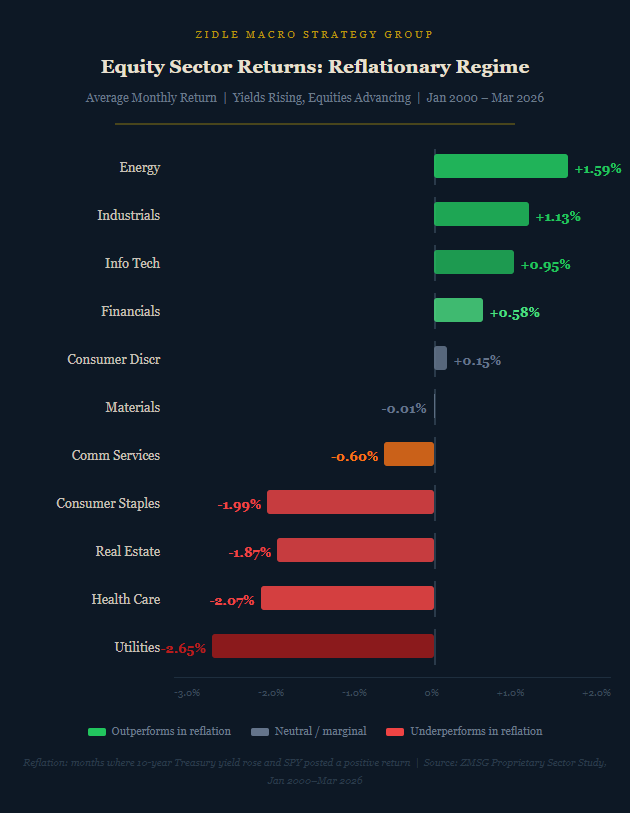
The public equity picture tells a consistent story, though through a different lens. The reflationary regime, defined as yields rising alongside an advancing equity market, is where the current environment most plausibly sits: the Fed is on hold, nominal growth is positive, and risk assets have not broken down. In that regime, Energy and Financials lead. Net interest margin expansion is the mechanism: rising rates widen the spread between what banks earn on assets and what they pay on liabilities.
The underperformers are equally clear. Real Estate, Healthcare and Utilities typically underperform. These sectors are routinely described as defensive, but in a reflationary environment their long-duration cash flows reprice lower as yields rise. They are rate-sensitive proxies in defensive clothing.
The Implication
This is not a prediction about what the 10-year will do next week. It is a sensitivity study: if rates stay here or move modestly higher, which asset classes absorb that without flinching, and which ones are quietly bleeding?
The data gives a clear answer. Floating rate credit sits at one end: structurally insulated, designed for this environment, generating incremental carry as rates rise. Growth equity and venture sit at the other: maximum duration, maximum rate sensitivity, and marks that in many cases still reflect 2021 vintage assumptions rather than a world where 4.5% is the floor, not the ceiling. Private real estate, particularly value-add strategies with floating rate debt at the asset level, concerns me most from a transparency standpoint. Cap rates adjust slowly. NAV marks adjust slower still. The quarterly report often tells you what happened six months ago.
In public markets, the reflationary data points in one direction. Energy and Financials have earned their place in a rising-rate portfolio through statistically verified performance across multiple cycles. Utilities and Real Estate have not, and the rate betas confirm it.
Sensitivity studies have their limitations. Manager alpha, and dispersion of returns can certainly compensate for downward pressures from rates. But the drag of higher rates can feel abstract until the numbers show up in a quarterly report. At 4.5%, we are not in tail-risk territory. We are in a regime where the data tells you precisely where the gravity is. The question for every allocator is not whether that gravity exists. It is whether the portfolio was built to account for it.
Important Footnotes: Private market rate sensitivity figures reflect ZMSG proprietary analysis. NAV impact estimates per 25 basis point move are modeled based on asset class duration profiles, structural characteristics, and historical spread behavior. Direct lending sensitivity assumes floating rate structures with SOFR-based coupons. All figures are estimates and subject to variation by manager, vintage, and portfolio construction.
Equity sector performance data reflects ZMSG proprietary analysis of monthly returns for S&P 500 ® Sectors from January 2000 through March 2026. Macro regime defined as: Reflation (10-year Treasury yield rising, SPY positive);
IMPORTANT DISCLOSURES
Zidle Macro Strategy Group is an independent macroeconomic research and commentary service. The content in this publication is informational and analytical in nature and does not constitute investment advice, a solicitation, or an offer to buy or sell any security or investment product. ZidleMSG is not a registered investment adviser, broker-dealer, or fiduciary under any federal or state securities law.
This publication does not recommend, endorse, or make any specific buy, sell, or hold recommendation for any security, ETF, mutual fund, private fund, or other investment vehicle. Any companies, individuals, or projects referenced are discussed solely for analytical and illustrative purposes. ZidleMSG has no financial relationship with, and receives no compensation from, any entity mentioned in this publication.
All commentary represents the views of the author based on publicly available information and macroeconomic analysis. Such views are subject to change without notice. Past commentary does not constitute a performance track record, and no representation is made that any analysis or forward-looking view will prove accurate.
Investing involves risk, including the possible loss of principal. Readers should conduct their own independent research and consult a qualified financial, legal, or tax professional before making any investment decision. ZidleMSG assumes no liability for any investment decisions made in reliance on this content.
© Zidle Macro Strategy Group. All rights reserved. Reproduction or redistribution of this content, in whole or in part, is prohibited without the prior written permission of ZidleMSG.