Every time we fill up our cars, we’re casting a vote in the world's most consequential auction; a daily referendum on geopolitical stability, industrial demand, and the precarious math of global supply chains.
That $4.50 gallon of gas? It's already worming through the economy. Six months from now, it'll surface in our grocery bills, Uber fares, heating costs, and if prices stay elevated, in what our paychecks can actually buy.
This is the oil transmission mechanism. It doesn't make headlines. It doesn't trend on Twitter. But it's one of the most reliable predictive relationships in macroeconomics. With war the Middle East and supply chains still fragile, understanding this mechanism is essential.
Part I: The Big Picture (Why Oil Still Runs the Table)
Here's a number most people understand: oil accounts for roughly 3-4% of global GDP in direct expenditure. But that's wildly misleading. The indirect footprint? Closer to 15-20% when you count transportation, manufacturing feedstocks, agricultural inputs, and heating.
Think of oil as the economy's operating system: invisible when it works, catastrophic when it doesn't. When oil gets expensive, everything that moves, grows, or gets manufactured starts to cough. The relationship isn't linear. It's multiplicative, cascading, and stubborn.
The modern economy was built on cheap energy. We've layered complexity on top of complexity from global supply chains, just-in-time manufacturing, suburban sprawl all predicated on the assumption that moving stuff around would stay cheap. When that assumption breaks, the leverage reverses. Fast.
Part II: The Transmission Mechanism (Follow the Money)
Let's trace how a sustained oil price increase flows through the economy. Think of it as a wave hitting different parts of the shoreline at different times, with different force.
Stage 1: Energy Direct (0-3 months)
The first impact hits direct energy consumption:
· Gasoline prices rise at the pump (usually within 2-4 weeks of crude moving)
· Diesel—the fuel of trucking, shipping, and heavy machinery—follows closely
· Jet fuel costs spike, pressuring airline tickets
· Residential heating oil and natural gas (price-correlated) increase utility bills
This is the headline shock—the part consumers feel immediately and politicians panic about. It's also the most visible, which is why policymakers often mistake it for the whole story.
Stage 2: Transportation Costs (1-6 months)
Next comes the logistics layer. Nearly every good in your life has been on a truck, train, ship, or plane. When diesel rises:
· Freight costs increase, raising landed costs for importers
· Shipping container rates adjust (though less directly than you'd think—fuel surcharges often lag)
· Last-mile delivery (Amazon, FedEx, UPS) becomes more expensive
· Public transit fares eventually adjust
This is where businesses face a choice: absorb the cost (squeeze margins) or pass it through (raise prices). In competitive markets with thin margins, they absorb. In concentrated markets with pricing power, they pass through. Guess which choice dominates over time?
Stage 3: Food and Agriculture (2-8 months)
Here's where it gets insidious. Modern agriculture is fossil-fuel-powered calorie production:
· Fertilizer is natural-gas-intensive (Haber-Bosch process), and natural gas often correlates with oil
· Farm equipment runs on diesel—planting, harvesting, processing
· Transportation from farm to processor to distributor layers fuel costs
· Refrigeration during transport and storage uses energy
· Packaging (plastics) is petroleum-derived
The result? A sustained $10/barrel increase typically translates to 1-2% food price inflation over 6-12 months. For households spending 10-15% of income on food, that's real money.
Stage 4: Core Goods (3-12 months)
Now we enter the manufacturing layer. Oil is embedded in:
· Plastics and petrochemicals (packaging, components, synthetic materials)
· Asphalt (road construction and maintenance)
· Lubricants (industrial machinery)
· Synthetic rubber (tires, seals, gaskets)
When oil stays elevated, manufacturers of everything from electronics to furniture face input cost pressure. Again, pass-through depends on market power, but over 6-12 months, core goods inflation inches higher.
Stage 5: Services and Wages (6-24 months)
This is the slow-moving, dangerous phase. As higher energy costs work through the economy:
· Cost of living increases visibly (everyone sees gas and grocery bills)
· Workers demand higher wages to compensate
· Service businesses (restaurants, hair salons, healthcare) face both higher input costs and wage demands
· Wage-price spiral dynamics can emerge if expectations shift
This is the secondary effect that central bankers lose sleep over. It's no longer about oil—it's about inflation expectations becoming unanchored.
Part III: The Rule of Thumb ($10 → +0.3% CPI, -0.1% Growth)
You've heard this heuristic: a sustained $10/barrel increase in oil prices adds roughly 0.3% to CPI and subtracts 0.1% from GDP growth. Where does this come from, and what are the caveats?
The Math Behind the Number
The 0.3% CPI estimate comes from econometric modeling by the Fed, IMF, and energy economists. Here's the breakdown:
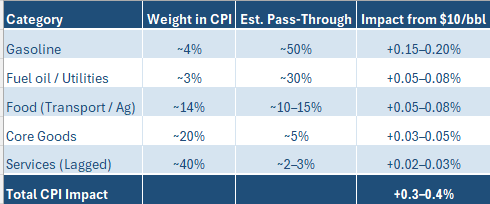
The growth impact (-0.1%) comes from reduced real disposable income (consumers spend more on gas, less on other stuff) and investment uncertainty (businesses delay capex when input costs are volatile).
Critical Caveat: "Sustained" Means Sustained
The rule assumes oil stays elevated for at least 6-12 months. A two-week spike? Barely registers in CPI. A six-month elevation? Now you're cooking with expensive gas.
Part IV: The Geopolitical Premium (When War Becomes a Line Item)
Not all oil price spikes are created equal. Some reflect demand strength as global growth accelerates. Some reflect supply constraints from OPEC cuts or shale delays. And some—the most dangerous—reflect geopolitical risk that threatens to sever the arteries of global commerce.
When traders price oil, they are not simply weighing today's supply against today's demand. They are weighing the probability of tomorrow's disruptions against the inventory buffers available to absorb them. This calculation produces two distinct phenomena: the risk premium and the disruption premium. Understanding the difference is essential because each behaves differently, persists for different durations, and demands different policy responses.
The risk premium emerges when tensions flare in regions that matter to oil markets. When Iran threatens Strait of Hormuz closure or when missile strikes hit near Saudi processing facilities, traders price in tail risk. The oil price rises not because supply has actually been disrupted, but because it might be. This is pure risk premium—insurance against a low-probability, high-impact event that could materialize overnight. Risk premiums can spike quickly, adding ten or twenty dollars per barrel in a matter of days. They can evaporate just as quickly if tensions ease or if diplomatic channels reopen. Risk premiums create volatility without changing underlying supply and demand fundamentals, and they often overshoot the fair probability-weighted value because traders hedge against the unhedgeable.
The disruption premium, by contrast, is the cold reality that sets in when war actually removes physical barrels from the market. When Iraq invaded Kuwait in 1990, when the Iranian Revolution collapsed exports in 1979, when OPEC enacted its embargo in 1973—these events did not merely threaten supply. They eliminated it. The disruption premium becomes structural because spare capacity gets tested and found wanting. The price rise necessary to balance the market becomes demand-destructive, meaning prices must rise high enough to force consumption down to match constrained supply. Disruption premiums sustain for months or years, trigger recession in oil-importing economies, and often alter long-term energy policy in profound ways. The 1970s oil shocks birthed the nuclear push and strategic petroleum reserves. The 2022 energy crisis accelerated renewable deployment and LNG infrastructure investment.
To make this concrete, consider the Strait of Hormuz scenario that keeps strategists awake at night. Roughly twenty percent of global oil consumption passes through this narrow waterway every day. If conflict threatened closure, we would see an immediate spike of thirty to fifty dollars per barrel as markets price in risk and strategic petroleum reserve release expectations. If the strait were actually constrained or closed, prices could reach one hundred fifty to two hundred dollars per barrel as global spare capacity of roughly three percent gets overwhelmed. The GDP impact for major importers like the United States, European Union, China, and India would range from negative one to negative two percent. The CPI impact would reach one and a half to two and a half percent within twelve months. This is asymmetric tail risk—low probability in any given year, high consequence, and potentially existential for incumbent politicians who failed to prepare.
Part V: Current Implications (The "So What")
Where are we now, and what should you watch? The current context presents a market in delicate balance, with enough spare capacity to absorb minor disruptions but not enough to survive a major one. OPEC plus holds four to five million barrels per day of spare capacity, which sounds comfortable until you realize it is concentrated almost entirely in Saudi Arabia and the United Arab Emirates. United States shale growth is slowing due to capital discipline imposed by investors after years of destroyed value, and because the inventory of prime drilling acreage is declining faster than many analysts assumed. Demand growth continues from aviation and industrial uses even as electric vehicle adoption curbs gasoline consumption growth. Geopolitical risks simmer across multiple theaters: Middle East tensions between Israel and Iran, Russia sanctions that have rewired global trade flows, and Red Sea shipping disruptions that demonstrate how quickly supply chains can fracture.
What matters now is not any single indicator but the interplay between them. The eighty to ninety dollar range represents a Goldilocks equilibrium high enough to fund OPEC budgets and shale investment, low enough to avoid demand destruction that would trigger recession. Sustained moves above one hundred dollars or below sixty dollars signal regime change that would force portfolio repositioning. Diesel cracks—the spread between crude oil and diesel prices—tell you about refinery capacity constraints and industrial demand strength. Wide spreads indicate tight markets and inflationary pressure that will flow through to transportation costs within months. Inventory levels at OECD commercial stocks provide the buffer against disruption. When they fall below five-year averages, prices become more volatile and vulnerable to any supply interruption. Geopolitical catalysts involving Iran, Hormuz, or major Saudi infrastructure represent immediate risk-off, oil-up events. The risk premium currently embedded in prices of roughly five to ten dollars appears underpriced given the range of potential escalations.
For investors, these dynamics create both opportunity and hazard. Energy equities remain levered to oil prices but also trade on the capital discipline narrative that has replaced growth-at-all-costs in boardrooms. At eighty dollars and above, the sector generates substantial free cash flow that returns to shareholders through dividends and buybacks. For inflation protection, Treasury Inflation-Protected Securities, commodities, and real assets provide hedges if oil drives sustained inflation that forces central banks to maintain higher rates for longer. Duration risk in fixed income remains elevated because oil-driven inflation keeps central bankers hawkish even as growth slows. Regional differentiation matters enormously. Energy importers including the European Union, Japan, and India face headwinds from elevated prices, while exporters including Saudi Arabia, Norway, and oil-producing regions of the United States benefit from revenue windfalls that can fund domestic investment or foreign asset purchases.
For policymakers, the challenges are equally complex. Monetary authorities face a difficult trade-off between hiking to control inflation and worsening growth, or holding to support growth and risking that inflation expectations become unanchored. The correct response depends on whether the oil shock is transient or sustained, a distinction that only becomes clear in retrospect. Fiscal policymakers confront the political temptation to implement energy subsidies that distort consumption decisions and blunt price signals that would otherwise drive efficiency gains. Targeted relief for vulnerable households beats broad price controls that create shortages and black markets. Strategic policymakers must recognize that strategic petroleum reserve releases can smooth temporary spikes but cannot reverse structural trends in supply and demand. Investments in energy transition infrastructure pay geopolitical dividends by reducing vulnerability to the very shocks that keep strategists awake at night.
Conclusion: The Invisible Tax Is Always Collecting
Oil isn't just a commodity. It's a regressive tax on economic activity, collected by producers and paid by consumers and businesses. It flows through the economy with the inevitability of gravity, raising prices and slowing growth in proportions that have remained remarkably stable for decades.
The $10 → +0.3% CPI / -0.1% growth relationship isn't a law of physics. It's a statistical regularity born of deep structural dependencies—dependencies that won't dissolve in our lifetimes, no matter how many EVs we buy.
When you see oil moving, you're not watching a market. You're watching a global tax rate change in real-time. The question isn't whether it'll flow through to inflation and growth. It's: how fast, how much, and are you positioned for it?
The invisible tax is always collecting. Smart investors and policymakers account for it.
White Paper Series
*This paper is for educational purposes only and does not constitute investment advice.*